In this issue
- Intel Solution Brief - Montefiore Creates Data Analytics to Advance Patient Care
- Free Webcast - A Time Machine for your Graph
- Gruff v7.0 Now Available!
- Franz Inc. named to the DBTA 100 - The Companies That Matter Most in Data
- The Semantics 2017 Conference - Amsterdam, September 11-14
- The Text Analytics Forum 2017 - Washington DC, November 8-9
- Recent Articles about Franz
- Follow us on Google Plus, Twitter, LinkedIn, and YouTube
Intel Solution Brief - Montefiore Creates Data Analytics to Advance Patient Care

Like all healthcare organizations, Montefiore faces complex challenges from government pressures to reduce costs and stringent regulatory guidelines to diverse patient populations and disruptive technologies. A focus and investment in precision medicine has brought the nation's and industry's attention to expanding the breadth of patient data in order to personalize treatment for individuals and historically underrepresented groups. Further, understanding patients requires information on a complex array of factors, some of which may not even be known during a clinical interaction, such as the home and work environment, nutrition, and genetics...
To read about their solution, see here
Free Webcast - A Time Machine for your Graph
August 23, 10 AM Pacific
Many use cases for a Graph Database, like AllegroGraph, involve temporal events. In general, "Events" are modeled as objects that have a start time, end time, a type, some actors and a geospatial location. In this webinar we will explore the temporal aspects of events using a set of practical examples from healthcare, government intelligence, the world of finance, and real estate.
With Gruff v7.0os new "Time Slider" feature, these examples really come to life. Using Gruff, a semantic graph browser, we will visually demonstrate how graphs that are comprised of temporal events are constructed over time, allowing time machine like exploration of your data.
To register for this webcast, see here
Gruff v7.0 Now Available!

New Features Include:
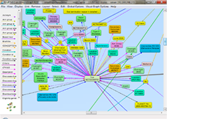
- Gruff 7.0 features a new time bar, which can be toggled on with the new command "View | Optional Graph View Panes | Show Time Bar". The time bar is used to compare nodes that have date (or date-time) properties, showing how nodes follow each other and overlap in time. It can also temporarily filter nodes from the display when they do not lie within a specified time range. There are several time bar options on the new "Visual Graph Options | Time Bar" child menu.
- Holding the mouse cursor over a node in the overview pane (the scroller pane at the lower left of the graph view) now displays the label of that node just above the overview pane. That may help find a node that you want to scroll into view. The overview pane will also draw the selected node in red and larger.
- The right-click pop-up menu for the node icons in the legend contains two new commands for highlighting or unhighlighting all of the matching nodes.
For additional information, see here and the Gruff Release History
Franz Inc. named to the DBTA 100 - The Companies That Matter Most in Data

Franz Inc., an early innovator in Artificial Intelligence and leading supplier of Semantic Graph Database technology, announced it has been named to the Database Trends and Applications (DBTA) 100 - 'The Companies That Matter Most in Data'. The world of data management is constantly changing. The DBTA 100 recognizes vendors who are evolving with the times and leading the charge to address new opportunities and requirements. Embracing the old and new, well-established and cutting edge, this fifth annual DBTA 100 list spotlights the companies that are dealing with evolving market demands through innovation in software, services, and hardware. The list includes long-established IT companies and newer upstarts anxious to shake up the data management space. Each year, the DBTA 100 presents "View from the Top" articles by company executives explaining how their organizations are uniquely addressing the data challenges of today and tomorrow...
See here to read the full release
The Semantics 2017 Conference - Amsterdam, September 11-14

SEMANTiCS 2017 is an international event on Linked Data and the Semantic Web where business users, vendors and academia meet. Widely recognized to be of pivotal importance, it is the thirteenth edition of a well-attended yearly conference that started back in 2005. It offers keynotes by world-class practitioners, presentations and field reports in diverse tracks, talks addressing a variety of topics, and panel discussions. And, of course, ample opportunities for networking and meeting like-minded professionals in an informal setting.
For additional information, see here
The Text Analytics Forum 2017 - Washington DC, November 8-9

Text Analytics is a platform technology that adds depth and intelligence to any organizationfs ability to utilize that most under-utilized resource V text. For many years the exponential growth of information has been experienced as a problem V information overload. However, with a new generation of text analytics tools and techniques, massive amounts of information are becoming part of the solution for an incredibly wide range of applications, from search that works to social media-fueled insights about customers and competitors to new flexible approaches to KM, new solutions to fake news, and more. The inaugural theme for Text Analytics Forum, Go Deeper, invites all who deal with text to take a deep dive into this powerful set of techniques.
For additional information, see here
Recent Articles about Franz
 | |
 |
|
 |
|
 |
|
 |
|
 |
|
 |
|
 |
|
Follow us on Google Plus, Twitter, LinkedIn, and YouTube


No comments:
Post a Comment